Sushi matters in Japan in three ways that official records can confirm. Its best-known form, nigiri, is about two hundred years old and began as a quick, casual meal eaten standing up at a stall. It is a regular line in household budgets: in 2025 the Statistics Bureau of Japan’s Household Survey put average annual spending on sushi eaten out at ¥17,975 per household. And it supports a trade: the 2021 Economic Census counted 17,388 establishments classed as sushi shops, with 211,651 people working in them. Below, each figure comes with its year and the body that published it, and with a note on what it does not show.
It began as a way of keeping fish, and became fast food
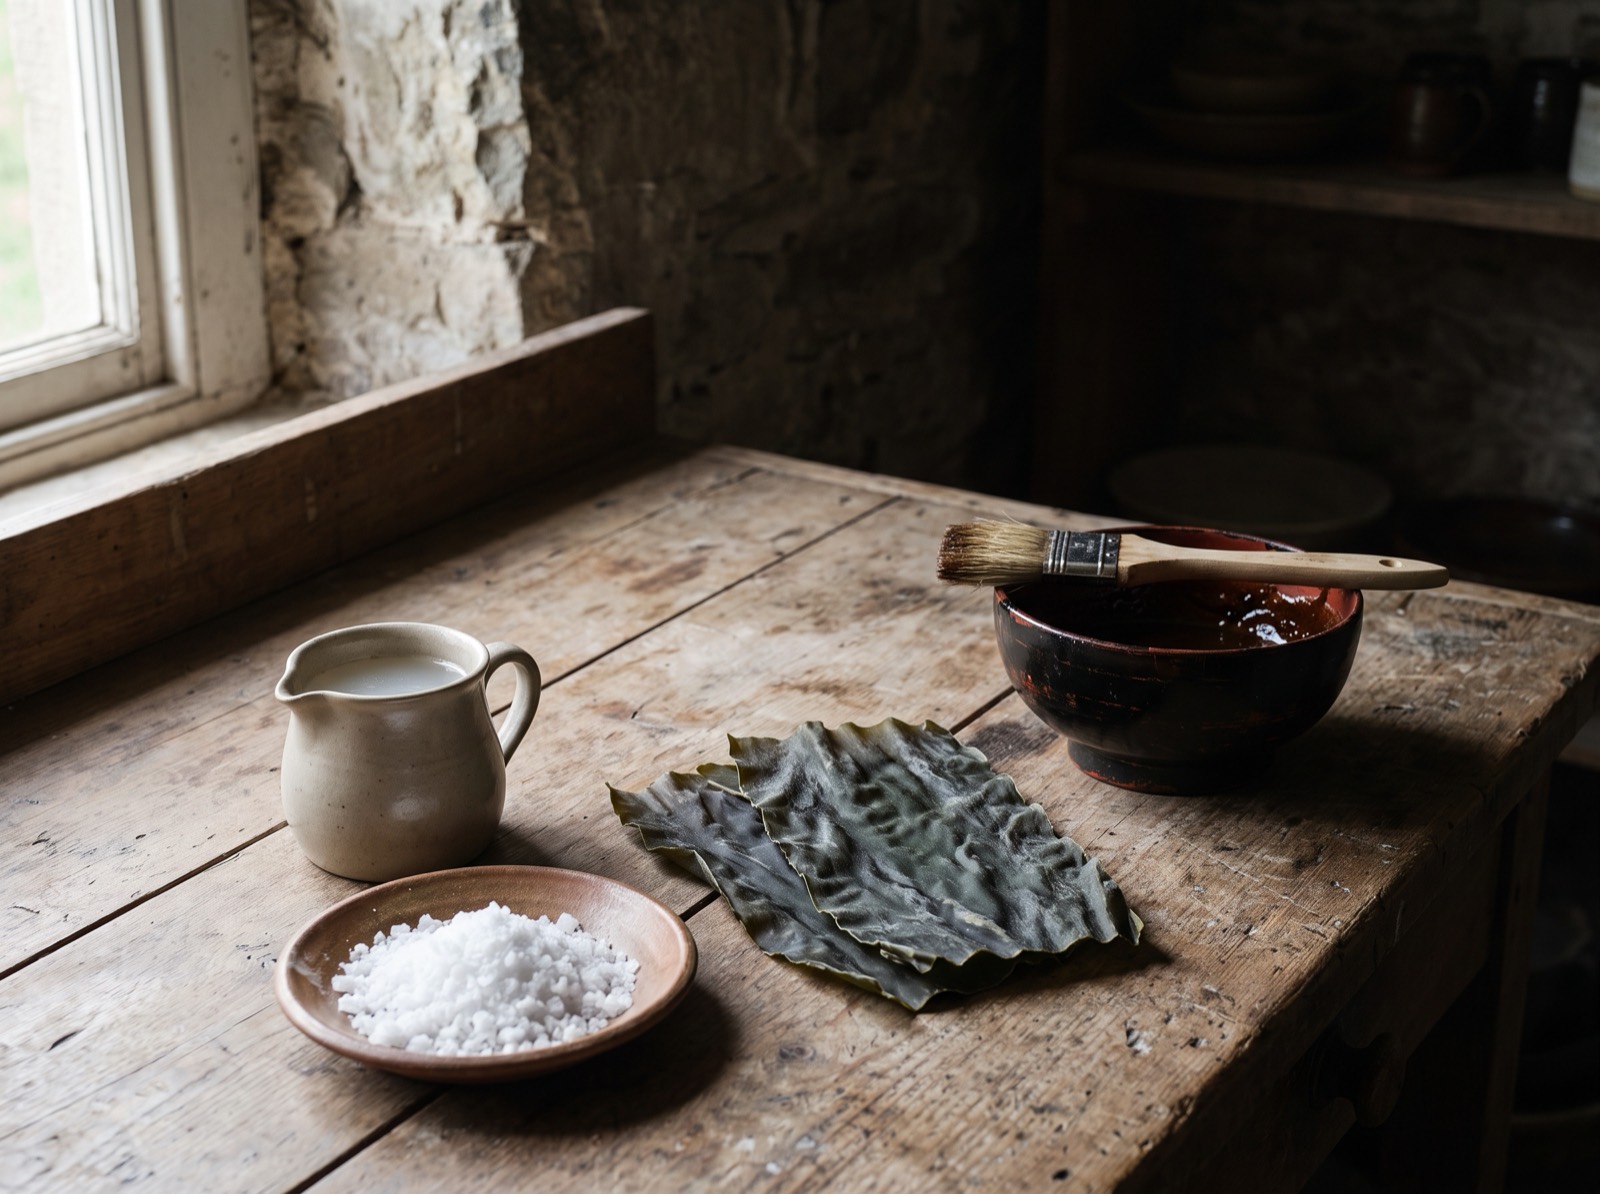
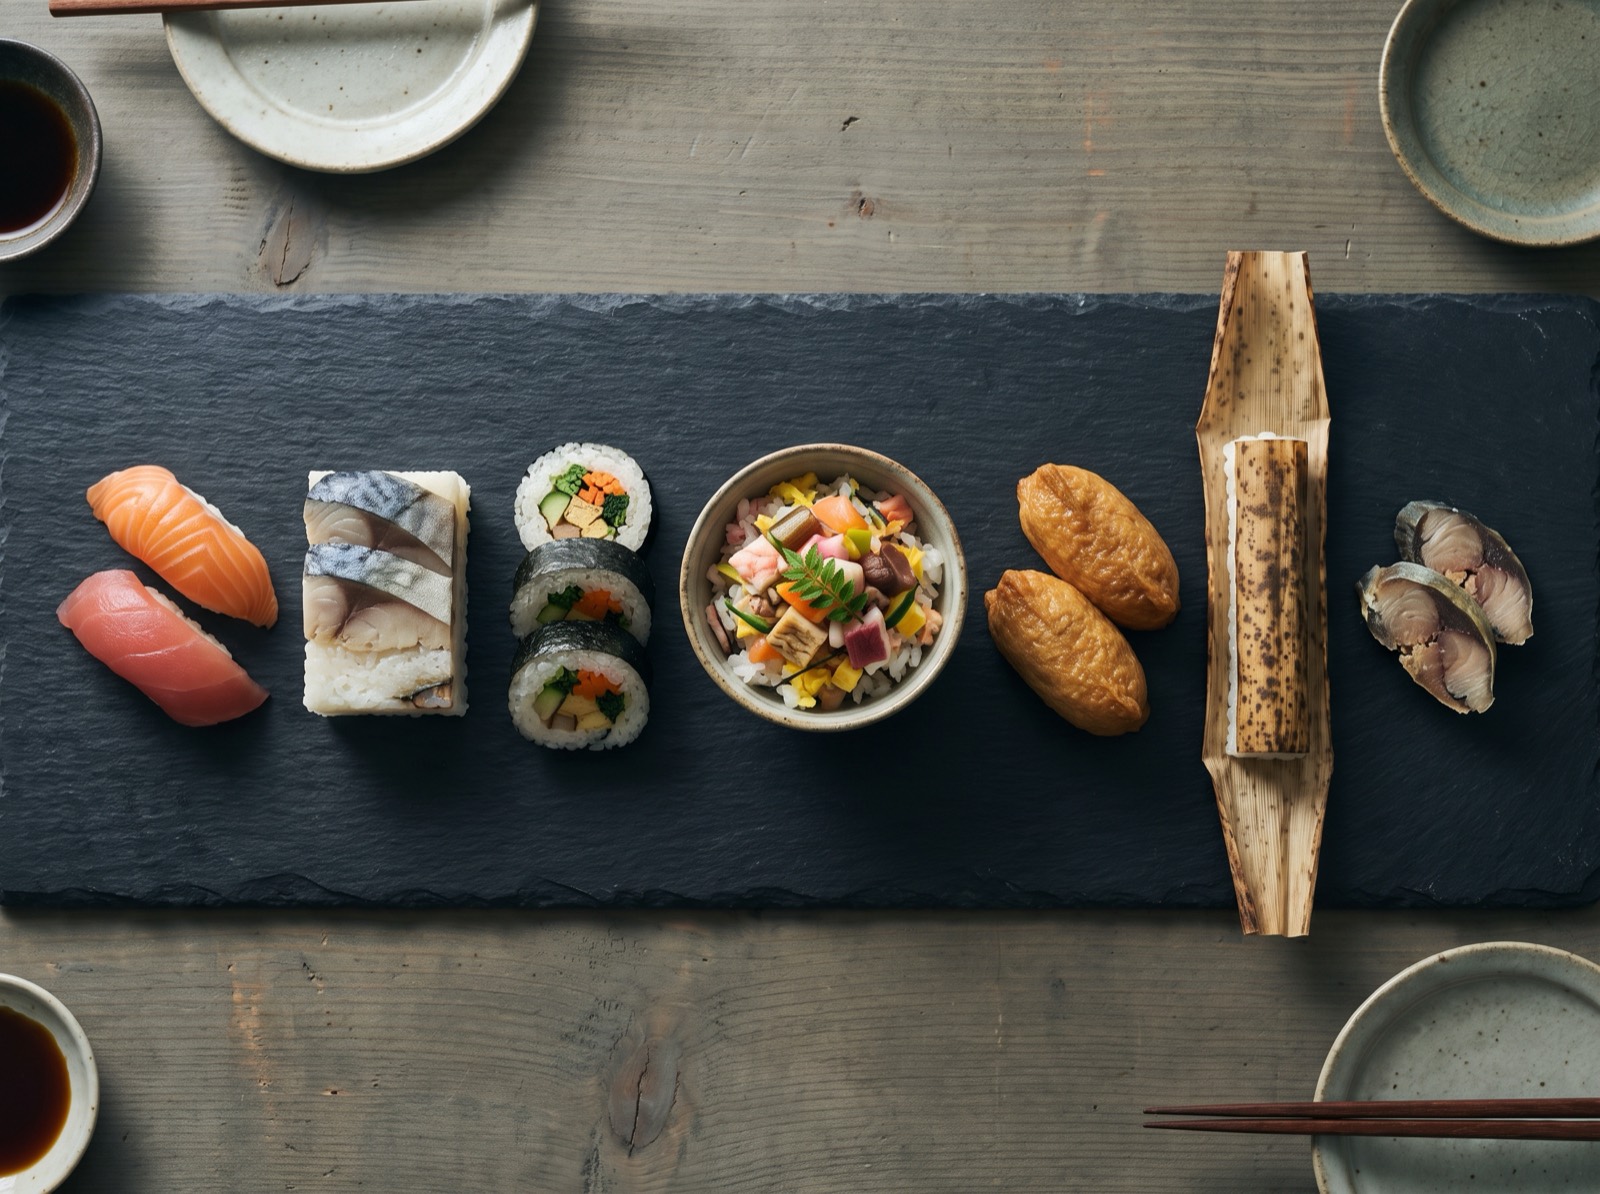
For most of its history sushi was a preservation method. It reached Japan around the Nara period as narezushi: fish packed in rice and left to ferment for months or years. Funazushi from Shiga, regarded as the starting point of Japanese sushi, is still eaten in parts of Japan. Later, shortening the fermentation left the rice intact, and for the first time rice and fish were eaten together. Sushi stopped being a preserve and became a dish. Our guide to the seven forms of sushi follows that sequence in order.
Nigiri is much younger. It was invented in Edo around 1820 — accounts differ on who, so we name no one — and it began as street food, eaten standing at a stall. A piece was not today’s bite-sized morsel but about the size of an onigiri rice ball. Kohada, a small silver fish, was the popular topping, and vendors carried it through the streets in round tubs. A woodblock print of a moon-viewing party by Utagawa Hiroshige, held by the Kanagawa Prefectural Museum of Cultural History, shows sushi stalls among the crowd.
Two events then spread nigiri across the country. One was the 1923 earthquake, after which chefs displaced from Tokyo returned to their home regions and took the technique with them. The other came after the Second World War, when food shortages restricted restaurant trade: sushi shops were allowed to operate on condition that they turned a fixed measure of rice into a fixed number of pieces, and that ration is said to have set the size of a piece of sushi that we still use. We do not give the ration figures, because the printed source we hold does not allow them to be checked.
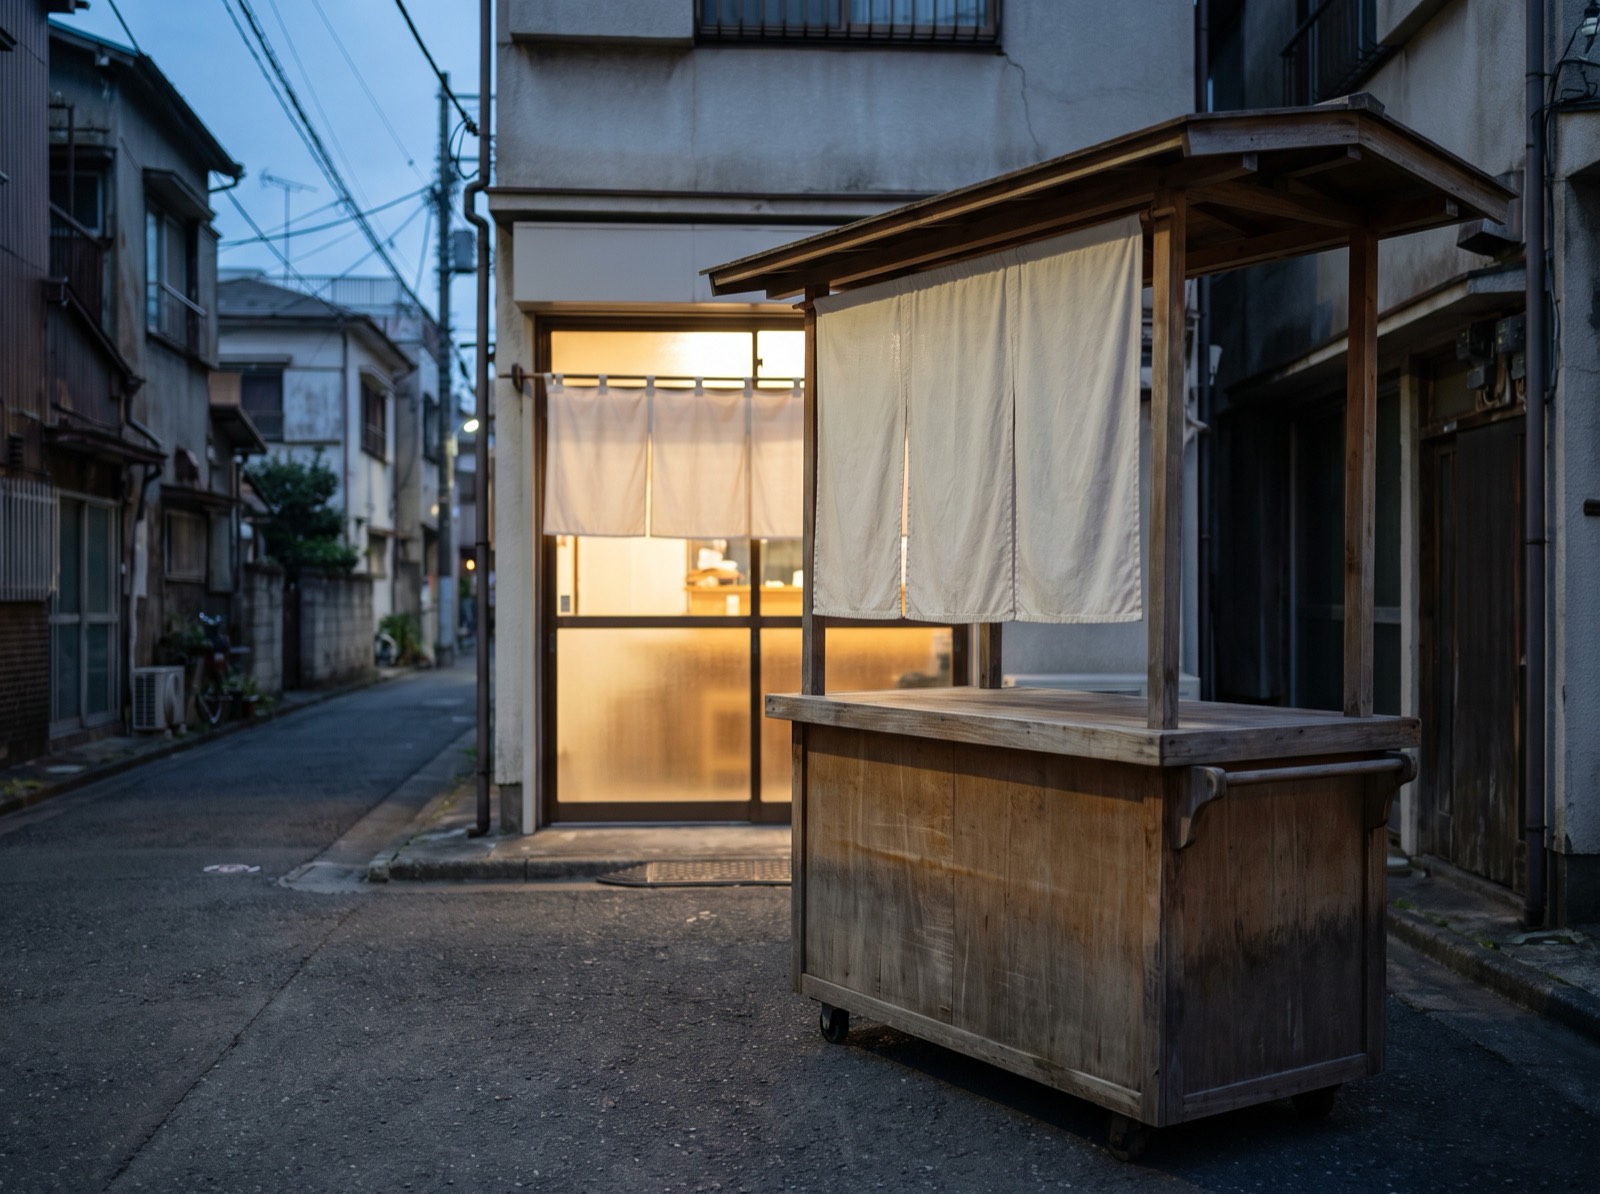
The stall gave way to the shop only gradually. A Japanese textbook on sushi science records that stalls stayed popular into the Meiji era, and that vendors who took premises ran what were called uchimise. Customers stood, the maker knelt to work, and from late Meiji into Taisho the trade was mostly delivery and takeaway. By then it was said that Kansai meant box sushi and Kanto meant nigiri. Once ice was easy to obtain, vendors began serving raw seafood on rice; shops added chairs, and that is the start of the sushi restaurant as it exists now. The same book adds that stalls disappeared after the war ended in 1945, on hygiene grounds, and that the noren curtain still hung over some counters today is a survival from them.
Two later changes show how far the form has travelled. The book notes that a stall offered a handful of toppings at most, while more than 20 is now normal, and that the rice, once onigiri-sized, shrank until a meal became up to twenty pieces. And in the 1980s, conveyor-belt sushi expanded in Japan and turned sushi into everyday food. The Edomae guide covers what the Edo-period curing and marinating techniques became once ice made them optional.
What households spend on it
The Household Survey is the Statistics Bureau’s standing record of what households buy. In its 2025 results, for households of two or more people and averaged nationally, annual spending per household was as follows (sample: 7,261 households).
- Sushi eaten out (sushi, gaishoku): ¥17,975
- Ready-made sushi bought away from eating establishments (sushi, bento): ¥16,300
- Eating out, all categories (includes school lunches): ¥198,759
- Food, all categories: ¥1,138,736
By our arithmetic, sushi eaten out is 9.0 percent of all eating-out spending and 1.6 percent of food spending. Adding the ready-made sushi bought away from eating establishments, the two sushi lines come to ¥34,275, or 3.0 percent of food spending. That ready-made sushi sits outside the eating-out total, so we do not add it to that denominator.
The same table lists other eating-out categories, which gives a sense of scale. Japanese-style meals, a broad heading, are ¥28,331; Western-style meals ¥14,720; Chinese noodles ¥9,711; yakiniku ¥8,852; soba and udon ¥8,080; hamburgers ¥6,941; and Chinese-style meals ¥5,486. These are separate line items in the survey, not a ranking, and they are not like-for-like: some headings are broad and some are single dishes.
The average household in the 2025 survey spent ¥17,975 on sushi eaten out and ¥16,300 more on ready-made sushi bought away from eating establishments.
Three limits apply. The averages include households that bought none, so they describe the whole sample, not a typical buyer. Households of one person are outside this table. And the survey’s own classification files “eating out” by who supplies the food, not where it is eaten: delivery sushi from an eating establishment counts as eating out, whether it is dine-in, delivered or taken home. The ¥17,975 is therefore not a figure for sit-down meals alone.
How large the trade is
The Economic Census for Business Activity is the government’s count of businesses. In the 2021 round, published in March 2023 by the Statistics Bureau and the Ministry of Economy, Trade and Industry, the class “sushi shops” had 17,388 establishments and 211,651 persons engaged as of 1 June 2021, and sales of ¥1,042,082 million — about ¥1.04 trillion — for 2020. Sales are in principle tax-inclusive. The tabulation covers privately run establishments for which sales and the other required items were obtained, so it is a count of that class, not of every place that sells sushi.
The neighbouring classes in the same table put it in context (establishments and persons engaged as of June 2021; sales in ¥ million for 2020).
- Soba and udon shops: 22,664; 152,463; 621,451
- Sushi shops: 17,388; 211,651; 1,042,082
- Restaurants other than specialist restaurants: 38,025; 303,097; 1,252,284
- Specialist restaurants: 134,890; 1,117,810; 5,723,729
- Bars and beer halls: 84,595; 384,580; 1,654,164
Sushi shops are fewer than soba and udon shops but record about 1.7 times the sales, and about 12 people work in an average sushi establishment against about 7 in a soba or udon shop (our arithmetic, from the same table). Average sales per establishment, dividing 2020 sales by the June 2021 count, come to about ¥60 million for sushi shops against about ¥27 million for soba and udon shops. That is a statement about the size of the class, nothing more. Sales are for 2020 alone and counts are as of June 2021, so the two describe different dates. Sushi served by establishments classed under other headings, such as specialist restaurants, is not broken out in this table.
Season and place
A Japanese handbook of sushi in English explains shun, the window in which a fish is at its fullest and fattest, and divides it in three: hashiri, the first of the season; sakari, the peak, when the fish feed actively before spawning and build up fat; and nagori, the stage just before spawning, when fish gather and catches rise but the peak has often passed. As a rule the season falls before spawning, not during it.
The same source points out that Japan runs a long way north to south, so the same fish spawns at different times in different places, and a single national answer to “when is it in season” does not really exist. That is why our season calendar gives the structure of the year and not a fish for every month.
Where washoku and UNESCO fit
On 4 December 2013 UNESCO inscribed washoku, traditional dietary cultures of the Japanese, on its Intangible Cultural Heritage list. It is a set of social practices around food, not sushi and not any single dish. The Ministry of Agriculture, Forestry and Fisheries lists four characteristics, the third of which is the expression of natural beauty and the turn of the seasons. For the full account of what was and was not inscribed, see Is sushi a UNESCO World Heritage?
What these records do not say
They measure dates, money and people. They do not measure meaning, and they do not support a claim that sushi is the most eaten, most valued or most representative dish in Japan; no figure here ranks it against other food. What they do support is narrower and checkable: a dish with a documented path from preserved fish to street food to restaurant, a household spending line of ¥17,975 in 2025, and a trade of 17,388 establishments, counted in June 2021.
Frequently asked questions
Why does sushi matter in Japan?
On the records used here: it has a documented history from preserved fish to Edo street food to restaurant food, it is a measurable line in household spending (¥17,975 per household on sushi eaten out in 2025), and it supports a trade of 17,388 establishments and 211,651 people (2021 Economic Census; sales are for 2020).
Is sushi Japan’s national dish?
The sources used here do not designate any dish as a national dish, and none of the statistics ranks sushi against other food. What UNESCO inscribed in 2013 was washoku as a set of practices, not sushi.
How much do Japanese households spend on sushi?
In the 2025 Household Survey, households of two or more people spent an average of ¥17,975 a year on sushi eaten out and ¥16,300 on ready-made sushi bought away from eating establishments. The averages include households that bought none, and eating out includes delivery sushi.
When did sushi become restaurant food?
Nigiri began as stall food in Edo around 1820. Shops called uchimise followed; by late Meiji and Taisho their trade was mostly delivery and takeaway. Once ice was easy to obtain, shops served raw seafood with chairs, which is the sushi restaurant as it exists now. Stalls disappeared after 1945 on hygiene grounds.
Is sushi a UNESCO heritage?
No. UNESCO inscribed washoku, traditional dietary cultures of the Japanese, on 4 December 2013, on the Intangible Cultural Heritage list. Sushi was not the subject, and no individual dish was.